


Why Invest in a Power Bank Rental Station?
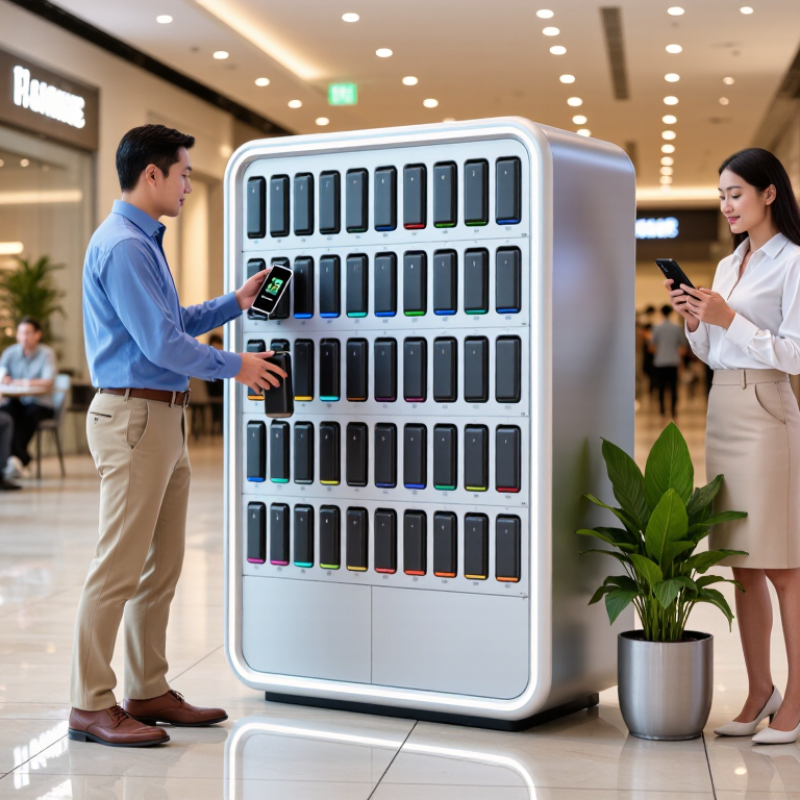
A Power Bank Rental Station turns a common frustration into a practical service. A visitor’s phone reaches 8% battery near a restaurant entrance. A traveler needs maps, tickets, or a payment app. The station offers immediate support without requiring a wall socket or personal charger.
“Convenience is the foundation of successful charging services,” says Jason Lee, a mobile-power infrastructure consultant. His observation reflects a basic business reality: people pay for access when the need is urgent. A well-placed station can serve shopping centers, hotels, airports, campuses, restaurants, and event venues. Each location creates different usage patterns. Foot traffic, dwell time, visibility, and return convenience matter more than installing equipment randomly.
The opportunity is attractive, but it is not automatic. Investors must examine hardware durability, battery safety, cleaning routines, software stability, and customer support. Small details matter. A damaged cable can stop a transaction. A hidden station can remain unused. Weak maintenance can quietly damage trust.
The numbers need honesty.
Revenue estimates may look impressive before rent, platform fees, replacement costs, and servicing are included. A careful operator tests one location first, measures daily rentals, and studies peak hours. This approach may feel slower, yet it reduces expensive assumptions. The strongest investment case combines useful infrastructure, disciplined operations, and realistic local demand. A Power Bank Rental Station should solve a visible problem, not simply occupy valuable floor space.
In 2024, the International Telecommunication Union reported about 5.5 billion people online worldwide. That figure strengthens the case for power bank rental stations. Connected users depend on phones for maps, payments, work messages, and emergency contact. A battery warning can interrupt a full day. Not a minor inconvenience. In transport hubs, shopping areas, cafés, and event venues, charging access becomes practical infrastructure.
A rental station can serve many users from a small footprint. The business earns from repeated short-term rentals, while venues gain a useful service for visitors. Good locations matter more than decoration. Operators should study foot traffic, dwell time, outlet access, device compatibility, and return behavior before placing equipment. Clear pricing and visible instructions build trust. Routine inspection also matters, because damaged cables, empty bays, or weak connectivity quickly reduce customer confidence. Usage data can reveal peak hours and improve distribution.
Still, 5.5 billion internet users do not guarantee profit. Internet access is uneven, and many people carry personal chargers. Some stations may sit unused outside busy periods. That is the uncomfortable part. A careful investor should test one location and track rental frequency, maintenance costs, return rates, and complaints. Test before scaling. The first plan may be wrong. Weather, local habits, and venue policies can change demand faster than expected. Reliable operations and transparent terms usually matter more than rapid expansion.
IDC’s Worldwide Quarterly Mobile Phone Tracker reported 1.24 billion smartphones shipped globally in 2024. Each device supports navigation, payments, messaging, work, and emergency contact. However, heavy daily use quickly drains batteries. A visitor with 8% power may not need a charger tomorrow. They need one now. A power bank rental station turns this urgent problem into a practical service. It can serve shoppers, travelers, students, and event guests within seconds. GSMA Intelligence reported about 4.7 billion mobile internet users in 2024. That figure shows how deeply mobile access shapes everyday movement. More connected users create more moments when portable power matters.
Tips: Place stations near entrances, seating areas, transport points, and checkout zones. Track rental frequency, return rates, charging status, and peak hours. Use clear pricing and visible safety instructions. A small screen can show available units instantly. Do not assume high foot traffic guarantees profit. An unused station still occupies space and requires maintenance. Poor placement can quietly weaken the entire investment. Battery quality, cleaning routines, cable condition, and responsible data handling also affect customer trust. The business case becomes stronger when operators test one location first, measure demand, and adjust carefully. Mistakes are likely, but measurable mistakes are easier to fix.
A power bank rental station earns from more than hourly usage. Rental fees create the core income, especially near cafés, transport hubs, campuses, and event venues. GSMA Intelligence reported about 4.6 billion mobile internet users worldwide in 2023. That large user base supports practical charging demand. However, location quality matters more than traffic alone. A busy corridor may produce fewer rentals than a quiet café entrance.
Refundable deposits can reduce loss and encourage timely returns. Terms must remain visible, simple, and consistent with local consumer rules. Advertising adds another layer. A screen or station panel can display local offers while customers wait. PwC’s Global Entertainment & Media Outlook continues to identify out-of-home advertising as a growing digital opportunity. Partnerships can improve stability. Venues may receive commission, while property operators gain a useful amenity without purchasing equipment. The model is not flawless. Empty stations, damaged units, and weak return rates can quickly reduce margins.
Tips: Track rentals by location, hour, and battery level. Test one site before expanding. Set a clear deposit policy. Review maintenance costs weekly. Negotiate partnerships using measured data, not optimistic footfall estimates. A small pilot often reveals uncomfortable truths.
A power bank rental station earns money only when devices circulate. Grand View Research valued the global power bank market at approximately $13.65 billion in 2023, with projected growth through 2030. Demand exists, but demand alone does not create profit. Location matters more than optimistic market forecasts.
Consider one station with 12 rentable units. If each unit completes 1.5 rentals daily, monthly usage reaches about 540 rentals. At $1.50 per rental, gross revenue equals $810 before costs. A stronger site may support two rentals per unit daily, but that assumption needs real checkout data. Events, transport hubs, and late-night dining areas can produce different utilization patterns.
Keep the model visible.
Electricity costs are usually minor. Maintenance is less predictable. Set aside 5% to 10% of monthly revenue for damaged cables, missing units, cleaning, payment disputes, and technician visits. A station costing $2,400, with $810 revenue and $180 monthly operating costs, produces about $630 before tax and installation expenses. The simple payback period is roughly four months. That looks attractive, perhaps too attractive. A 30% utilization decline extends payback beyond six months. Industry research can estimate market direction, not your exact location. Use a 60-day pilot, record hourly rentals, repeat users, downtime, and unrecovered deposits, then revise pricing. Source: Grand View Research, Power Bank Market Size, Share and Trends Analysis Report, 2024.
A power bank rental station earns attention where phone use and waiting time overlap. High-traffic venues provide both conditions. Airports, shopping centers, campuses, and entertainment districts can create repeated demand. GSMA Intelligence reported 4.7 billion mobile internet users worldwide in 2024. More connected people also means more charging pressure.
Location quality matters more than station quantity. Place units near entrances, food courts, ticket queues, and transport exits. These areas offer visibility and natural pauses. UN Tourism recorded about 1.4 billion international tourist arrivals in 2024. Travel hubs therefore deserve careful testing, especially where visitors lack familiar charging options. However, foot traffic alone is not enough. A crowded corridor may produce poor rentals if users cannot stop safely. I learned that convenience often beats raw visitor volume.
Tips: Test two or three sites before scaling. Track rentals by hour, repeat usage, average rental duration, and return rates. Compare weekday and weekend behavior. Keep spare units nearby, because an empty bay loses trust quickly. Clear pricing and simple instructions also reduce hesitation. Local staff feedback matters, although it can be inconsistent. Review the data monthly, and move weak stations instead of protecting a poor decision.
Location-planning benchmark for prioritizing high-traffic venues. Estimates are based on typical visitor volumes, dwell times, and mobile-device charging needs; actual performance should be validated with a four-week site pilot.
| Venue Type | Typical Monthly Visitors | Average Dwell Time | Peak Demand Periods | Recommended Stations per Site | Estimated Monthly Rentals | Estimated Rental Conversion | Recommended Placement | Priority Level | Location Strategy Rationale |
|---|---|---|---|---|---|---|---|---|---|
| Transportation Hubs | 500,000–1,000,000 | 25–75 minutes | Weekdays, 7:00–10:00 and 16:00–20:00 | 6–12 | 6,000–12,000 | 1.2%–1.5% | Waiting areas, transfer corridors, food courts, and ticket halls | Very High | Large visitor volumes and waiting time create frequent urgent charging needs, while several access points support rapid station utilization. |
| Shopping Malls | 250,000–500,000 | 90–180 minutes | Friday evenings, weekends, and holidays | 4–8 | 7,500–13,000 | 2.5%–3.0% | Food courts, cinema entrances, central atriums, and customer-service areas | Very High | Long visits increase battery consumption from navigation, payments, social media, and entertainment applications. |
| Entertainment Districts | 50,000–150,000 | 120–240 minutes | Thursday–Saturday, 18:00–01:00 | 3–6 | 4,000–9,000 | 6.0%–8.0% | Restaurant clusters, venue entrances, nightlife corridors, and restroom areas | Very High | Extended evening visits and heavy smartphone use for communication, photography, payments, and ride-hailing drive strong demand. |
| Sports and Concert Venues | 40,000–120,000 | 150–240 minutes | Event days, typically 17:00–23:00 | 4–10 | 3,000–8,000 | 6.0%–7.0% | Entry gates, concourses, premium areas, and food-and-beverage zones | High | Concentrated visitor surges and long event durations can produce high rental volume, although utilization varies by event calendar. |
| Universities and Colleges | 25,000–60,000 | 120–360 minutes | Weekdays, 09:00–18:00 | 3–6 | 1,500–3,500 | 4.0%–6.0% | Libraries, student centers, cafeterias, and lecture-building entrances | Medium | Students spend long periods on campus and depend heavily on mobile devices, but demand is concentrated around academic terms and weekdays. |
| Hospitals and Medical Centers | 80,000–180,000 | 90–240 minutes | Weekdays, 08:00–17:00; emergency areas operate continuously | 3–7 | 1,600–4,000 | 2.0%–2.5% | Waiting rooms, outpatient entrances, cafeterias, and visitor lounges | Medium | Patients and visitors may need reliable communication during lengthy waits, but placement must comply with facility safety and operating policies. |
| Hotels and Convention Centers | 20,000–80,000 | 180–720 minutes | Check-in periods, conferences, weekends, and event schedules | 2–5 | 1,200–4,500 | 3.0%–5.0% | Lobby, reception area, conference registration, and lounge spaces | Medium | Guests and delegates often spend extended periods onsite and require charging for navigation, digital tickets, communication, and business activities. |
| Large Office Complexes | 30,000–120,000 | 180–480 minutes | Weekdays, 08:00–18:00 | 2–5 | 900–3,000 | 2.0%–3.0% | Reception areas, shared workspaces, cafeterias, and visitor entrances | Medium | Stable weekday traffic provides predictable demand, particularly in buildings with visitors, flexible workers, and shared amenities. |
USA / Americas
1507 Capital Ave, Suite 102
Plano, TX 75074
+1 (214) 838-7010
8:00am – 5:00pm (GMT-6)
Australia / Asia Pacific
503 Cross Keys Rd,
Cavan SA 5094
+61 8 7200 3909
9:00am – 5:00pm (ACDST)
© 2025 Green Frog Systems. | Privacy Policy | Terms & Conditions


